Charts and Graphs
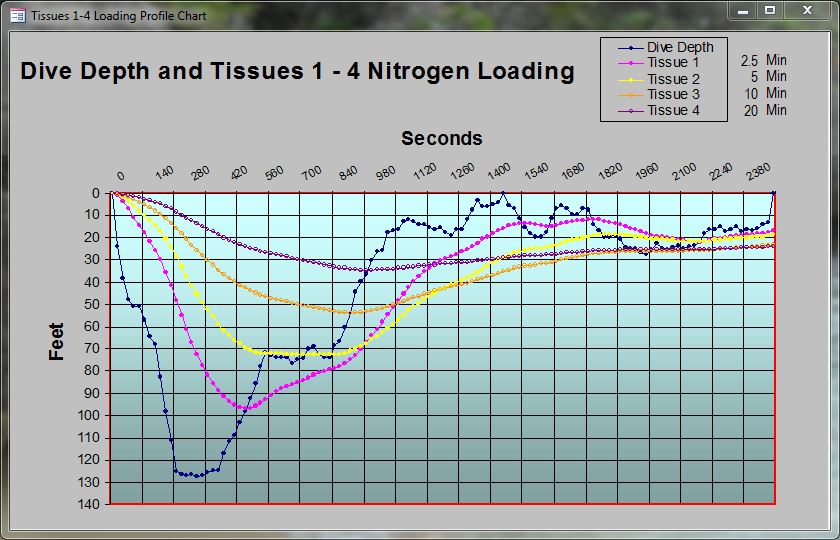
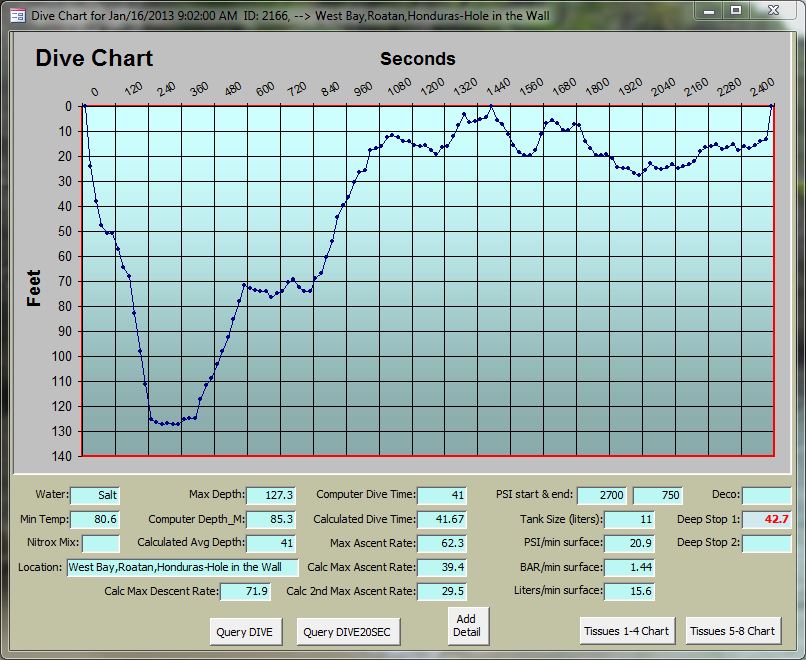
For this database, I charted the data into a visual graph. Graphing, in some cases, may prove more meaningful than a report consisting of a bunch of numbers. These charts are produced directly within Access, so there is no need for an export to an external program to graph the data.
Copyright © Cymovv 2013. All rights reserved.